
Here I will discuss about how to read candlesticks

Anatomy Candlesticks
Every candlesticks consist of a candle bar and a wick a body is like a candle stick reflects the difference between the open and close prices in a given period. The open and close prices are the first and last transection for that period. When you don't see any candle or smallest candles, it means that the open and close price are almost the same.
The wick or tail is a small thin line above and below it that represent the high and low prices for the period. When the wick appears above candle, it shows the highest price for that period. If there is no upper wick the top of the candle is the highest price, I hope you can get the point. likewise, the wick at the bottom of the candle indicates the low price for that period. If there is no lower wick, the bottom of the candle is the lowest price.

Candlestick bar color
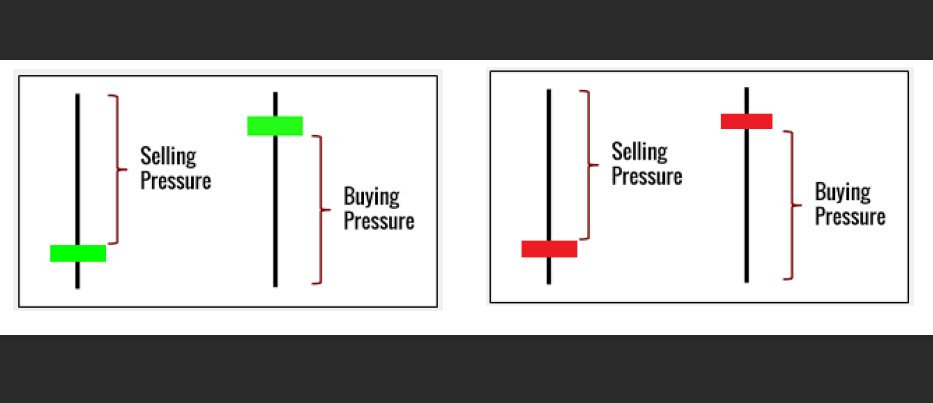
The bar are colored and depend on the scheme used by the charting platform. Generally green and red. A green candle means that the price finished higher during that time period. where the closing price is above the open price. And a red candle means that the closing price was at a lower level during that time period.

The green candlesticks indicate strong buy pressure, it is usually gives a Bullish price signal. However, they must be seen in the context of market structure. And the red candlesticks indicate significant sell pressure, it is usually show the price is being Bearish
The bar are colored and depend on the scheme used by the charting platform. Generally green and red. A green candle means that the price finished higher during that time period. where the closing price is above the open price. And a red candle means that the closing price was at a lower level during that time period.
The green candlesticks indicate strong buy pressure, it is usually gives a Bullish price signal. However, they must be seen in the context of market structure. And the red candlesticks indicate significant sell pressure, it is usually show the price is being Bearish
click here Continuing about Market Price Trends and understanding what is Bullish and Bearish


